
Why many commercial systems still fail — a practitioner’s take
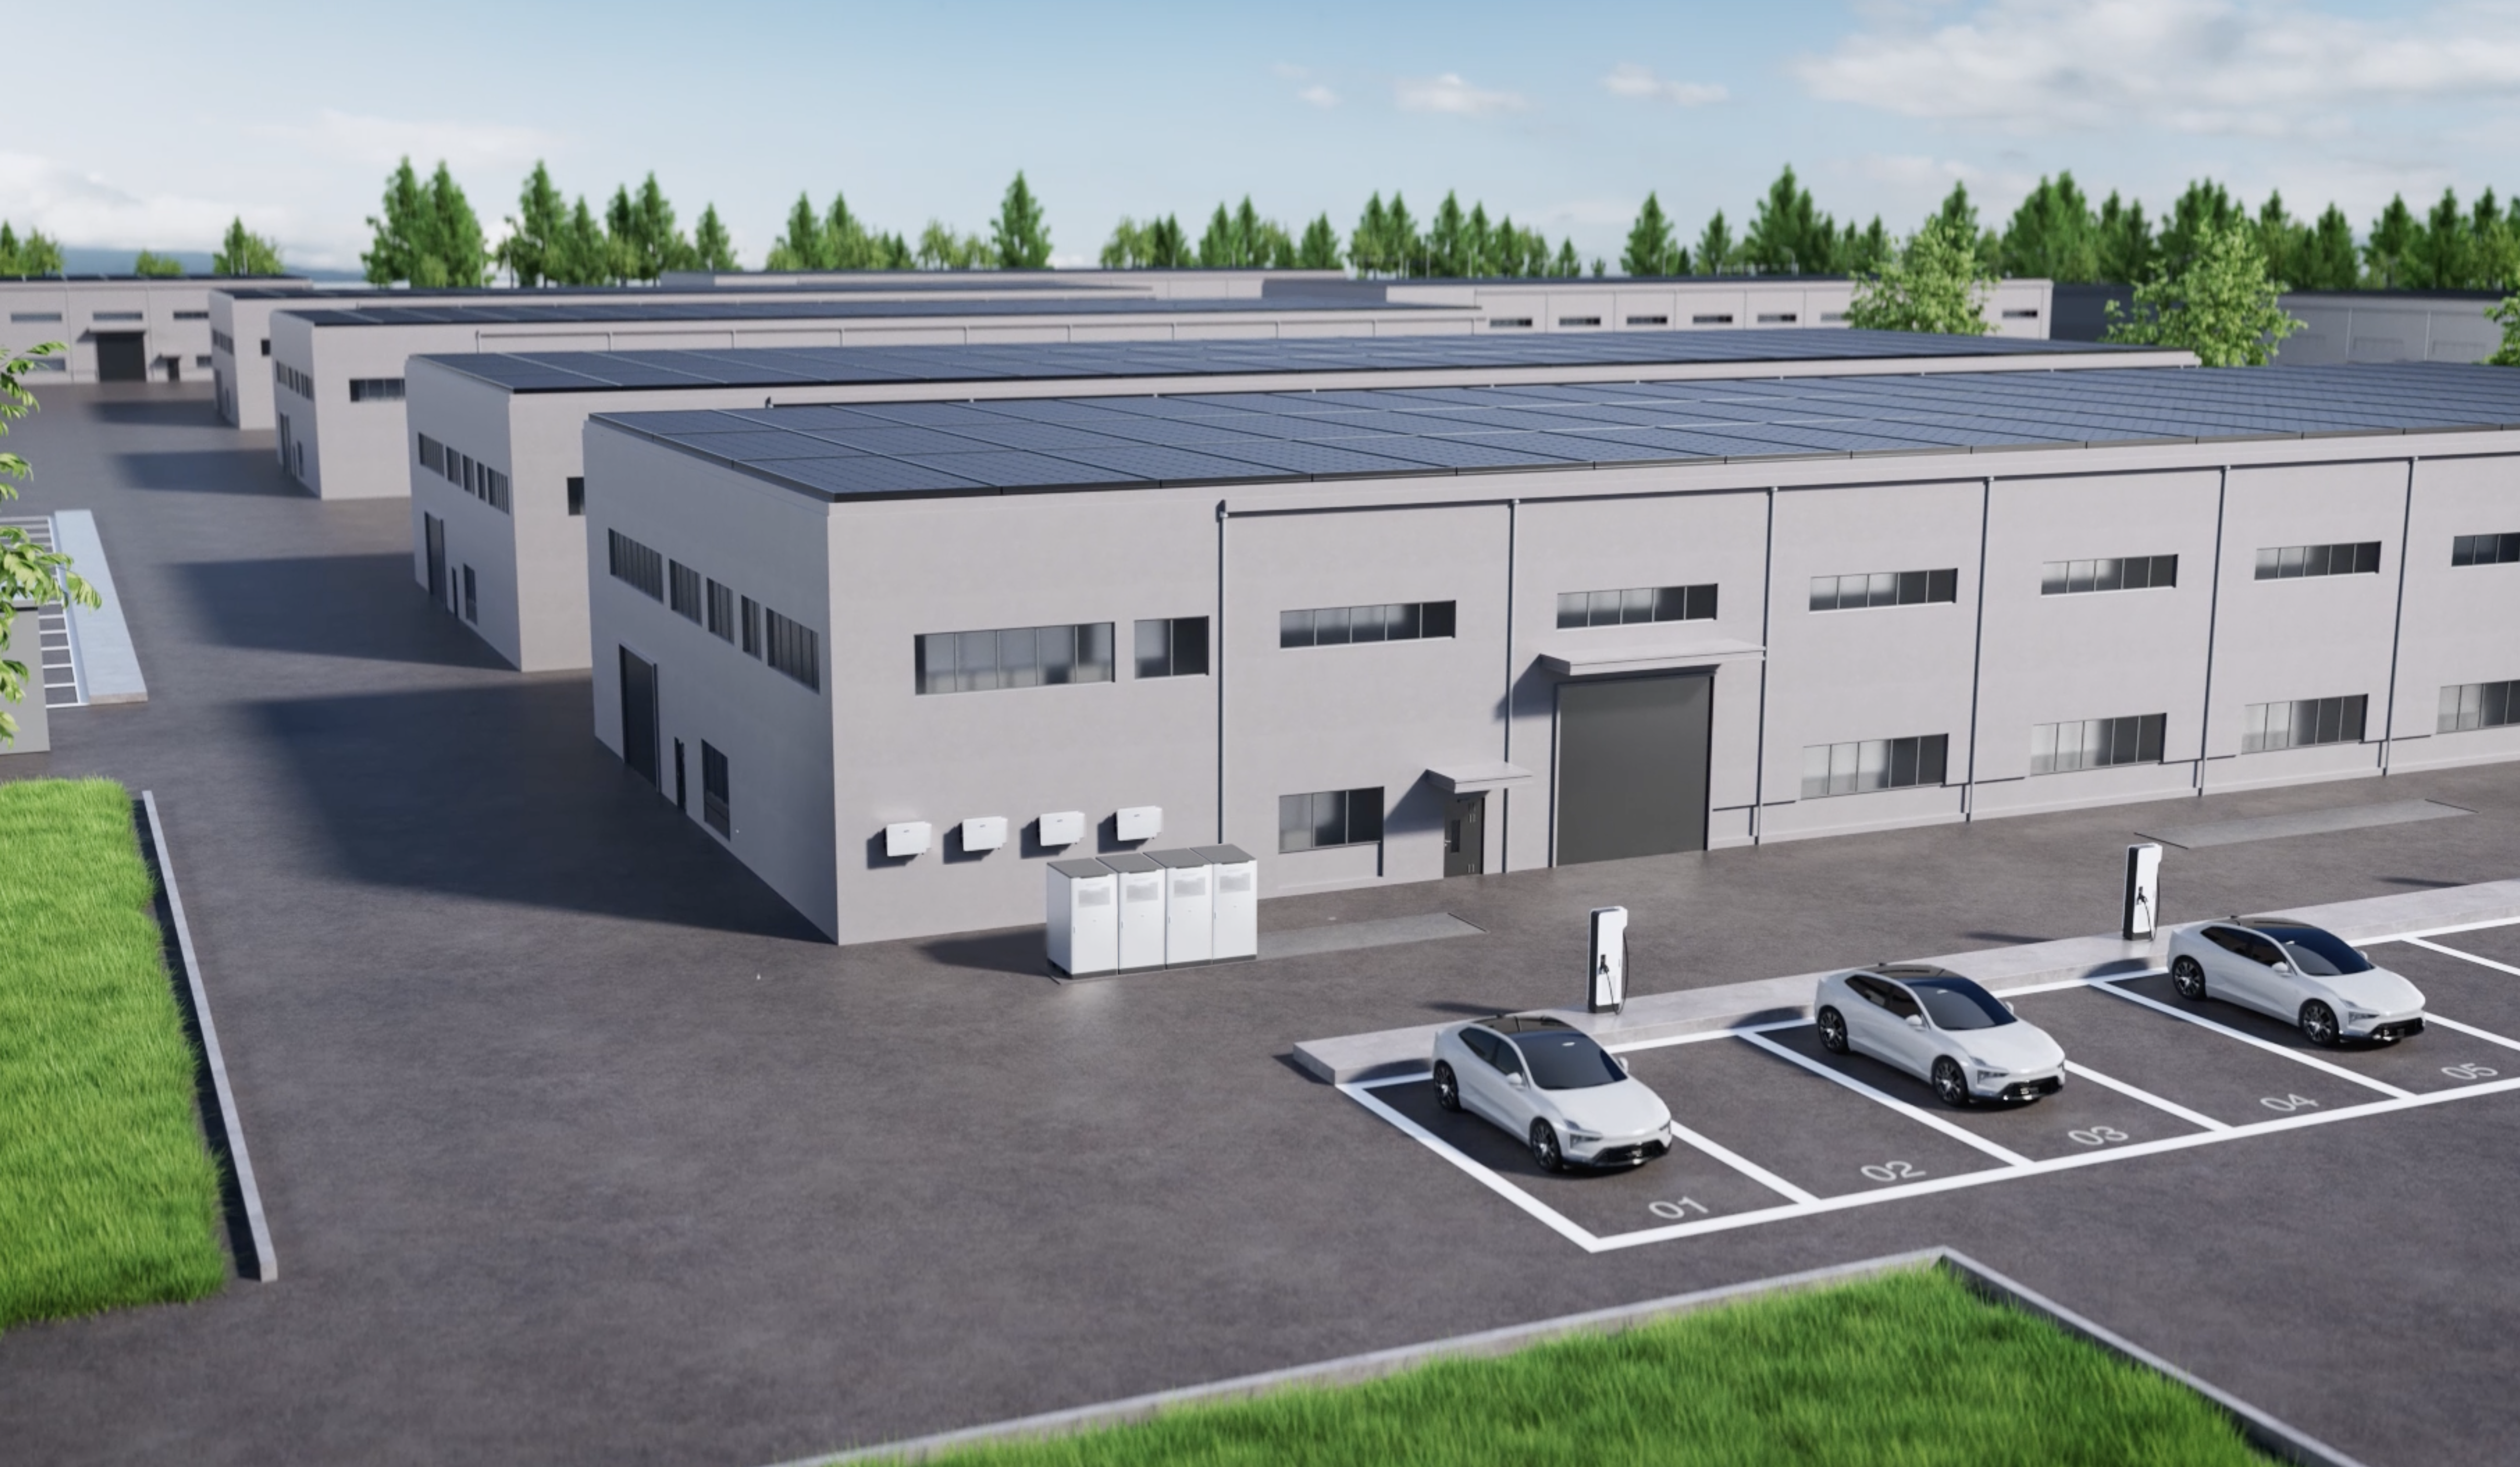
I once walked onto a dusty rooftop in Tangerang and saw panels installed in 2019 that never reached their rated output — a simple misorientation ruined months of ROI. In that scenario the site produced only 62% of expected energy (a 500 kW PV array), so what caused the gap and how do we fix it for C&I Solar? I write about the commercial solar system realities I meet daily, and I say this plainly: most failures are not the panels but the assumptions behind them (di Jakarta, not a rare case).
I have over 18 years in commercial solar sales and field installs; I remember a June 2019 rooftop job where a wrong inverter spec led to clipping losses that cost the client an estimated 35,000 kWh in year one — that was real money, not theory. I notice three repeated flaws: oversimplified load profiles, weak commissioning, and ignoring non-energy costs like demand charges. I detail each: load profiles that use monthly averages miss peaks, commissioning often skips thermal mapping, and demand charges can swallow expected savings. These are not gimmicks; they are predictable errors we can measure. Now, let’s move to what we actually do differently next.
Where does the money really leak?
Forward-looking comparisons: upgrades that actually pay back
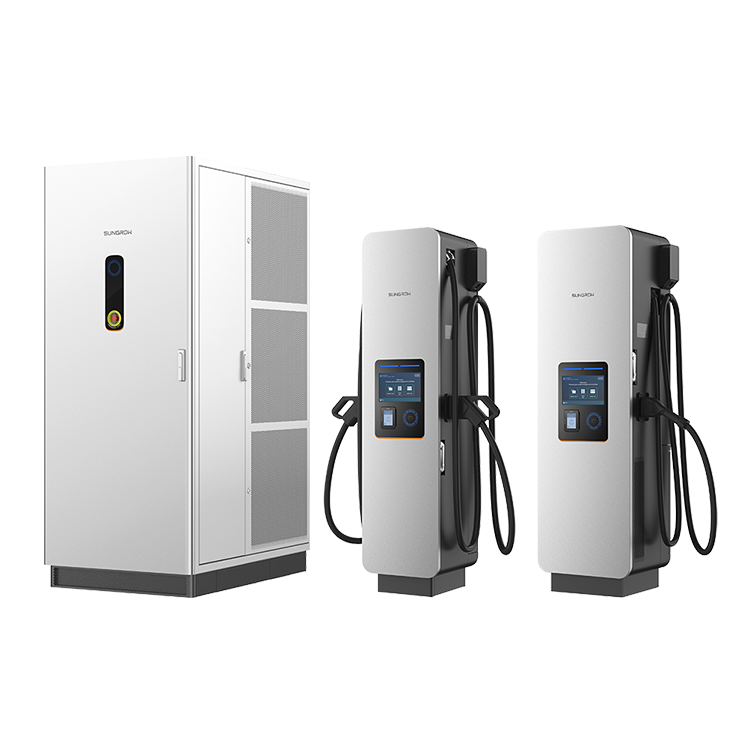
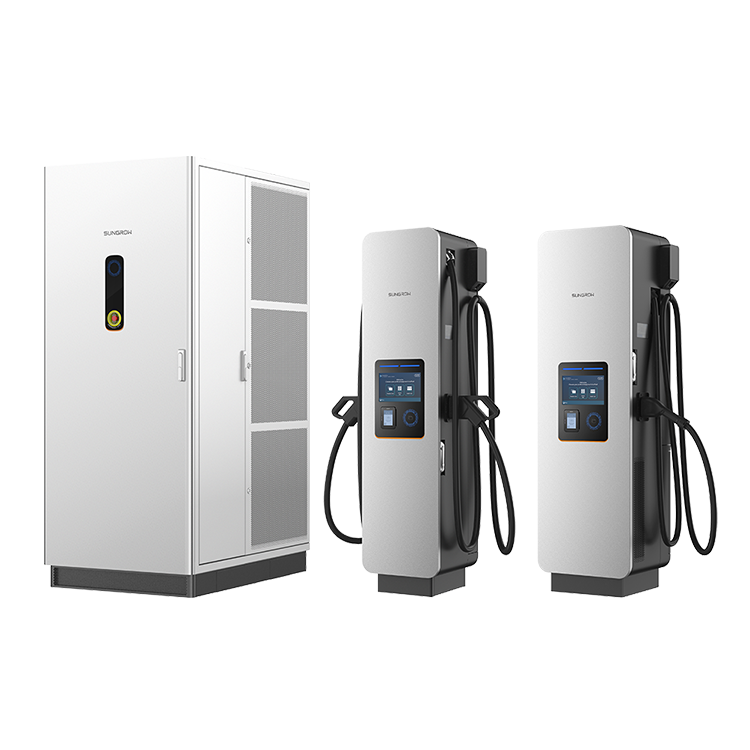
First, define the core choice: do you stick with a basic grid-tie setup or upgrade to a hybrid design with energy storage? A basic grid-tie commercial solar system is cheaper up-front but often undercuts long-term value when demand charges are high. I compare three options I sell and service: standard PV-only, PV with smart inverter control, and PV plus energy storage with peak-shaving logic. Each has a different cash flow profile — and I say this from direct installs and meter data audits.
From a technical view, energy storage lets you shift kWh away from peak windows; smart inverter features improve reactive power and voltage ride-through, reducing penalties. I ran a pilot in Bekasi (Q1 2021) where adding 250 kWh storage cut peak demand by 22% — payback moved from 8 years to 5.5 years. Consider these metrics: LCOE per kWh, demand-charge reduction percentage, and system availability. They are simple. They are measurable. They guide procurement. It’s not fancy — it’s practical.
What’s Next?
We now choose by evidence: simulate with real hour-by-hour loads, bench-test inverters with expected thermal stress, and insist on full commissioning reports that include I-V curves. I advise buyers to require three things from vendors: measured performance guarantees, clear fault-ride-through specs, and a maintenance SLA with response times. If you ask me, the easy wins are smarter inverters and modest battery capacity for demand shaving — the capital is targeted, not just bigger capex. (Yes, I know the sales pitch looks different, but the numbers speak.)
Summary — three evaluation metrics I recommend: 1) expected demand-charge reduction (percentage), 2) real annual kWh yield under site-specific shading profile, and 3) guaranteed system availability and response SLA. Use those to compare quotes. I will keep building solutions like this with clients — and I often point them to proven suppliers that match these specs, like sungrow. Wait — one last practical tip: always audit utility bills back three years. You will thank me later.